Debt to EBITDA Ratios: The One Metric That Quietly Drives Private Equity
Debt to EBITDA Ratios: The One Metric That Quietly Drives Private Equity
The last 25 years of Debt to EBITDA trends, and what's going on today

As a CFO, I’ve faced the familiar chaos: manually updating the Revenue & Customer Cube, leading to costly delays and blind spots in forecasting, strategic decisions, and investor reporting. Every CFO knows how crucial real-time access to this accurate, structured, deeply segmented data foundation is—but consistently maintaining it is another story.
A recent study of 100+ PE-backed finance leaders shows that moving from data chaos to disciplined automation isn’t just achievable—it’s transformative for your enterprise value.
If you’re done chasing spreadsheets and want revenue intelligence you can actually trust, this white paper lays out a clear, actionable framework.
Download the Perfect Cube Blueprint
The One Metric That Quietly Drives Private Equity
Private equity doesn’t work without debt.
It’s how firms target +20% IRRs. It’s how they amplify wins without increasing the equity check… And it’s also how they get into a catastrophic pickle when rates spike or the exit window closes.

Everyone talks about valuation multiples. But the metric that actually governs private equity behavior is much simpler: Debt to EBITDA ratios.
The state of this metric allows investors to get in and out, and ultimately impacts how far the valuation multiples can stretch.
Here’s how that ratio has changed over the last 25 years, and why it still defines dealmaking in 2025.
-
2000–2007: Loose Lending
-
2008–2009: The Retrenchment
-
2010–2019: Rebuild and Expand
-
2020–2022: Peak Aggression
-
2023–2025: The Reset
Let’s jump in
The Leverage Cycle

2000–2007: Loose Lending
-
Typical Leverage: 5 to 6x
-
Covenant-lite structures were common.
-
Senior debt came from banks, mezzanine filled the gap.
-
Deals were underwritten to adjusted EBITDA with aggressive add-backs (you could put a lot of BS in there).
Wait, WTF is Mezzanine?
Mezzanine debt sits between senior debt and equity. It’s unsecured, higher-yielding, and often comes with equity kickers (like warrants). Think of it as the risk-seeking middle child of the capital stack — flexible, pricey, and willing to take a bet when banks won’t.
Back to our regularly scheduled timeline…
2008–2009: Retrenchment
-
Typical Leverage: 3 to 4.5x
-
The financial crisis forced lenders to pull back.
-
Equity contributions increased as a result.
-
Cash interest coverage and downside cases regained relevance.
Wait, WTF is Cash Interest Coverage?
-
The cash interest coverage ratio (also known simply as the cash coverage ratio) is a financial metric that assesses a company's ability to cover its interest expenses using its available cash flow.
-
Unlike the traditional interest coverage ratio, which utilizes earnings before interest and taxes (EBIT), the cash coverage ratio focuses on true cash flow from operations, providing a more precise picture of a company's liquidity and its ability to service debt in the short term.
-
It’s a litmus test for your ability to keep your head above the debt waters organically by building what you build and selling what you sell.
Back to our regularly scheduled timeline…
2010–2019: Rebuild and Expand
-
Typical Leverage: 5 to 6.5x
-
Rates stayed low.
-
Direct lending grew.
-
SaaS and recurring revenue models supported leverage over 7x.
-
Unitranche became popular.
Wait, WTF is Unitranche?
Unitranche is a hybrid loan that combines senior and junior debt into a single facility. Instead of having:
-
A first-lien term loan at, say, SOFR + 400 bps, and
-
A second-lien loan at SOFR + 800 bps,
A unitranche loan might be structured at a single blended rate (e.g., SOFR + 600 bps), often with fewer lenders involved and simpler documentation.
Why Did Unitranche Become Popular?
-
Simpler structure = faster deal execution: One agreement, one lender (or a tight club), one set of terms. That means less time negotiating intercreditor agreements and easier coordination post-close.
-
Private credit funds loved it: Direct lenders like Ares, Golub, and Owl Rock could offer unitranche structures to win deals, keep all the economics, and avoid sharing control with banks or mezz funds. When times are good, lenders want the whole steak, even if it’s bordering on holding too much risk.
-
PE sponsors preferred it: It allowed them to move quickly, reduce execution risk, and often get more flexible terms — particularly for middle-market deals.
-
Operators asked for it : You only need to report your financial results to one lender each period, you avoid stacking covenants from multiple parties, and if things went south you only have to work with one bank.
Back to our regularly scheduled timeline…
2020–2022: Peak Aggression
-
Typical Leverage: 6.5 to 7.5x, occasionally higher
-
Profitable SaaS deals could stretch past 8x
-
Capital was abundant, and interest rates were low.
-
Lenders competed for allocation, and wrote bold term sheets.
-
Sponsors pushed leverage as far as the model allowed, and sometimes further.
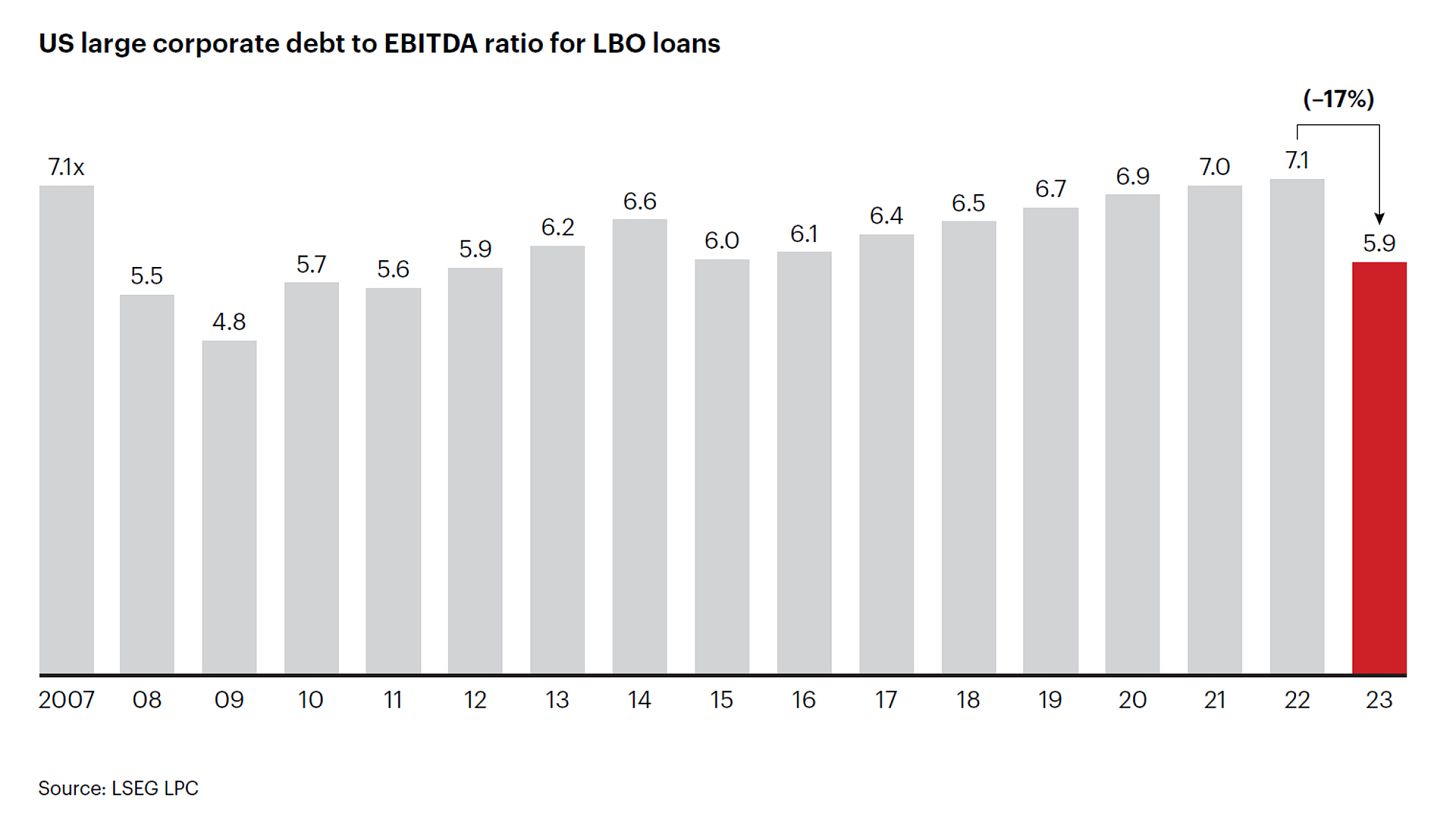
2023–2025: Reset
-
Typical Leverage: 4.5 to 5.5x
-
Rate hikes and weaker exits shifted the market.
-
Lenders became more selective.
-
Cash flow mattered again.
-
Deal structures normalized.
Where Things Stand in 2025
Most transactions are clearing at 5.0x leverage. That’s for businesses with real earnings, strong cash conversion, and squeaky clean reporting.
-
Premium assets with stable margins may see 6.0x, but they’re the exception.
-
Pre-EBITDA tech deals are being heavily structured or sidelined altogether.
Private credit is still in the game, but with stricter terms:
-
Tighter covenants
-
Larger equity buffers
-
Limited tolerance for pro forma gymnastics
The Capital Stack Has Compressed

In today’s environment, most deals are getting done with just the senior layer. If junior debt shows up, it’s in small doses — and it usually comes with warrants or higher equity risk.
What’s in each tier?
Senior Debt
-
Usually a mix of revolvers and first-lien term loans
-
Lower cost, secured, and comes with tighter controls
-
Provided by banks or private credit funds (the latter typically at 200 bps higher)
Junior Debt
-
Includes mezzanine, second lien, holdco notes, and seller paper
-
Higher risk, higher yield
-
Mostly disappeared post-2022 unless the business is rock solid
In prior cycles, 7x leverage often included 2 to 3x of junior capital: mezzanine, second lien, holdco notes, or seller paper.
Today, most of that is gone. Sponsors are relying almost entirely on senior debt, and even that comes with more scrutiny.
Senior lenders are holding the line at 5 to 5.5x. If junior capital appears, it’s smaller, more expensive, and usually includes warrants or other upside instruments.
The composition of the stack reflects market psychology:
-
In risk-on environments, junior capital expands.
-
In conservative markets, it vanishes.
Implications for Operators
-
Capital structure matters again
-
You can’t assume debt will show up on favorable terms. Lenders want downside cases, cash flow visibility, and execution credibility.
-
Equity checks are rising
-
With lower leverage, sponsors are funding more of the deal with equity. This affects return math, capital efficiency, and ownership dynamics.
-
Stretch structures are scarce
-
If a deal needs 6.5x leverage to pencil out, it may not be financeable. Operators must assume a lower ceiling and build their models accordingly.
Summary
Private equity hasn’t abandoned leverage. But it’s relearning discipline.
In 2021, you could pencil in 7.5x debt and someone, somewhere would fund it.
In 2025, you’d better hope for 5.0x, and prove you deserve more.
Every model starts with a multiple. The smart ones start with a ratio.
Thanks for reading, and make sure to check out our sponsor,Finqore . You ain’t gotta get ready if you stay ready for a fundraise or exit. Download their white paper on the perfect data cube.
Download the Perfect Cube Blueprint
Keep Reading
VIEW MORE
Looking for Leverage
Join the list to receive our newest posts straight to your inbox.
Looking for Leverage
A weekly playbook for PE-backed CFOs and execs. Deep dives on margin expansion, smart capital use, and exit strategy.
Home
Archive
Authors
Login
Reset Password
Update Password
Profile
Search