The 2026 AdMob & Mobile Monetization Playbook [TESTED]
- Products
- PubGuru®
- PubGuru Lightning Script
- PubGuru Analytics
- Traffic Cop
- Solutions
- PubGuru Premium
- Traffic Cop Premium
- Unified Pricing Rules
- Outstream Ads
- Offerwall Studio
- Company
- About Us
- Media Center
- Careers
- Affiliate Partner Program
- Contact
- Resources
- FAQs
- Blog
- Webinars
- Video Library
- Case Studies
- Partner Integrations
- Notification Center
- Ad Revenue Calculator
- Affiliate Program FAQs
Home / Blog / The 2026 AdMob & Mobile Monetization Playbook
Home / Blog / The 2026 AdMob & Mobile Monetization Playbook
The 2026 AdMob & Mobile Monetization Playbook
Blog
February 20, 2026 | by Kean Graham
The app economy has crossed a structural inflection point. What was once a relatively approachable marketplace has become something closer to a high-frequency trading floor, where milliseconds of latency, fractional eCPM movements, and algorithmic bidding wars determine who captures real revenue and who leaves it for someone else.
In 2026, developers who treat monetization as an integration task rather than a strategic discipline will not just underperform. They will actively subsidize the publishers who have built a proper revenue infrastructure. Global in-app advertising revenue crossed $362 billion in 2024 and is projected to exceed $495 billion by the close of 2026, according to Statista.
In the same period, the average eCPM gap between top-quartile publishers and median publishers has widened to 340%. This performance gap is not explained by audience size, app quality, or category. It is explained entirely by the monetization architecture. The top publishers are not just running more ad networks. They are running smarter systems: real-time bidding infrastructure, first-party data pipelines, server-side mediation, and geo-segmented floor pricing strategies that most developers have not implemented or even evaluated.
This playbook is the definitive MonetizeMore guide for publishers who have already integrated AdMob and are ready to move from running ads to operating a data-driven revenue system.
Platform Fundamentals: The Google Backbone
Google AdMob remains the default monetization engine for early and mid stage apps.
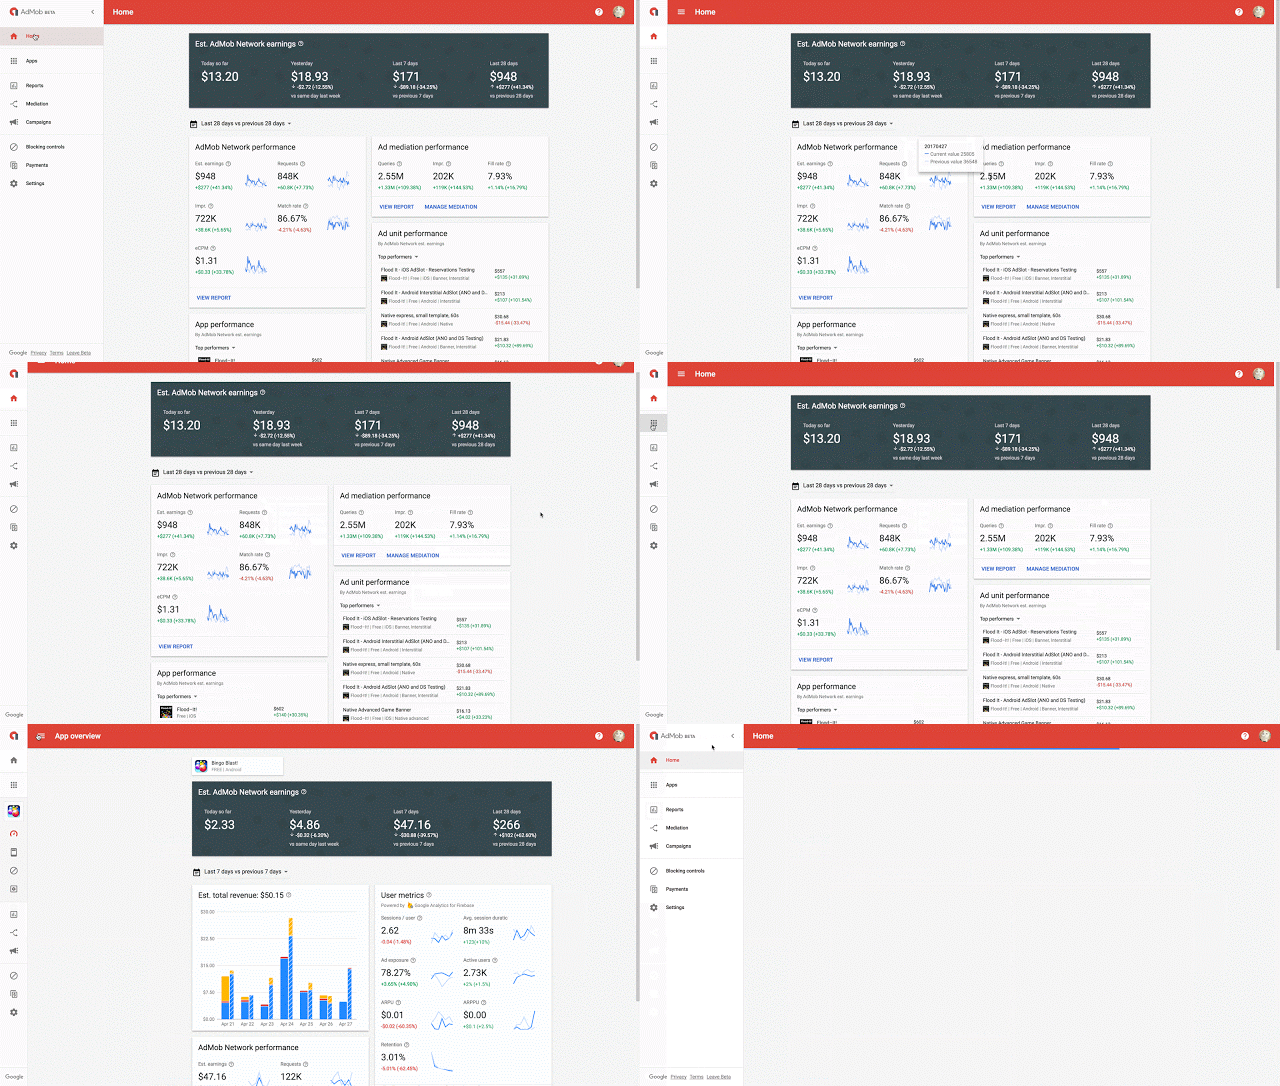
Key scale indicators in 2026:
- Over 1 million live apps monetizing through AdMob
- More than 2 billion monthly active users reached globally
- Integration time under one hour for most Firebase-based apps
- Access to Google demand, including Google Ads, Display, and Video 360 buyers
For a new gaming app with 50,000 daily active users, AdMob alone can generate $5,000–$7,000 per month when properly optimized with rewarded video and interstitials. That is solid baseline liquidity.
But here is the reality. Publishers who layer bidding and advanced mediation on top of AdMob often increase ARPDAU by 20 to 60 percent within three to six months.
AdMob is reliable. It is global. It is stable. It is also just one bidder in a competitive auction.
Result-Driven Ad Format Hierarchy: Revenue by Design
Format selection now directly shapes lifetime value. The highest earning apps align monetization with behavioral triggers, not random placements.
Banner Ads
Typical Tier 1 eCPMs range from 0.50 to 2.10 dollars. Global averages often fall between 0.25 and 0.90 dollars.
Banners are low impact and easy to scale, but they rarely exceed 10 to 15 percent of total ad revenue in high performing apps. Their strength lies in steady background monetization during long session durations.
Example: A finance-tracking app with 30,000 DAU running persistent adaptive banners can generate $ 600 to $ 900 per month from banners alone, assuming strong Tier 1 traffic.
Native Ads
Tier 1 eCPMs commonly range from 1.50 to 4.00 dollars. Engagement rates are 2 to 3 times higher than traditional banners when the design is matched correctly.
Native ads drive strong retention because they feel integrated. In content-heavy apps such as news, sports, or social feeds, native units often account for 40 percent or more of total ad revenue.
Example: A content app with 100,000 DAU and 3 feed scroll sessions per day, inserting one native ad every 10 content cards, can generate 3,000 to 8,000 dollars monthly from native placements alone.
Interstitials
Tier 1 eCPMs frequently range between 6.00 and 12.00 dollars. Poor timing can reduce Day 7 retention by 10 to 25 percent.
When triggered at logical transitions such as level completion, quiz submission, or task completion, interstitials remain powerful. When triggered mid action, they destroy engagement.
Example: A puzzle game with 20,000 DAU and 4 sessions per day, showing one interstitial per session at level clear, can generate roughly 1,400 to 3,000 dollars monthly, depending on geography mix.
Rewarded Video
Rewarded video dominates monetization in gaming and increasingly in utilities.
Tier 1 eCPMs range from 18.00 to 45.00 dollars. Global averages often sit between 10.00 and 22.00 dollars. Completion rates regularly exceed 85 to 95 percent when rewards feel meaningful.
Top gaming apps now derive 50 to 70 percent of ad revenue from rewarded units alone.
Let’s say a hyper casual game with 15,000 DAU, 5 sessions per day, and 1.5 rewarded ads per session can generate $ 3,000 to $ 9,000 monthly, depending on traffic quality and bidder competition.
If you want leverage, build around rewarded. Everything else supports it.
Benchmark Revenue by App Category
One of the most common gaps MonetizeMore identifies when onboarding new publisher clients is a fundamental absence of revenue modeling. Publishers know their daily active users and their approximate eCPM. But they have not built the connective tissue between those numbers: the session-level model that translates audience behavior into predictable daily revenue and reveals precisely where optimization investment should go. Revenue modeling is not a complicated exercise. It is a disciplined one.
The benchmarks below reflect MonetizeMore portfolio data for publishers running properly configured mediation stacks with at least 5 competing demand sources.
Standalone AdMob deployments should discount these by 20 to 30%. The discount amount is the immediate revenue opportunity that mediation represents for your specific category.
Here’s the table converted into clean text format:
App Category | Daily Rev (1K DAU) | Monthly Estimate | Key Assumptions
Hyper-Casual Game | $60 to $95 | $1,800 to $2,850 | 3.2 sessions per day, 6 ads per session, rewarded video as primary format, Tier 1 traffic mix above 40%. Utility / Productivity | $20 to $35 | $600 to $1,050 | 1.8 sessions per day, lower deliberate ad density, banner and interstitial focused, mixed geo traffic. News / Content App | $12 to $25 | $360 to $750 | High scroll depth, native and banner heavy, strong engagement signals but lower session frequency. Mid-Core RPG | $95 to $180 | $2,850 to $5,400 | Hybrid IAP plus ads model, longest average session time, rewarded video deeply embedded in game economy, strong Tier 1 user base.
Technical Architecture: Where Revenue Leaks
Most revenue losses do not show up as errors. They show up as a missed opportunity.
SDK Latency
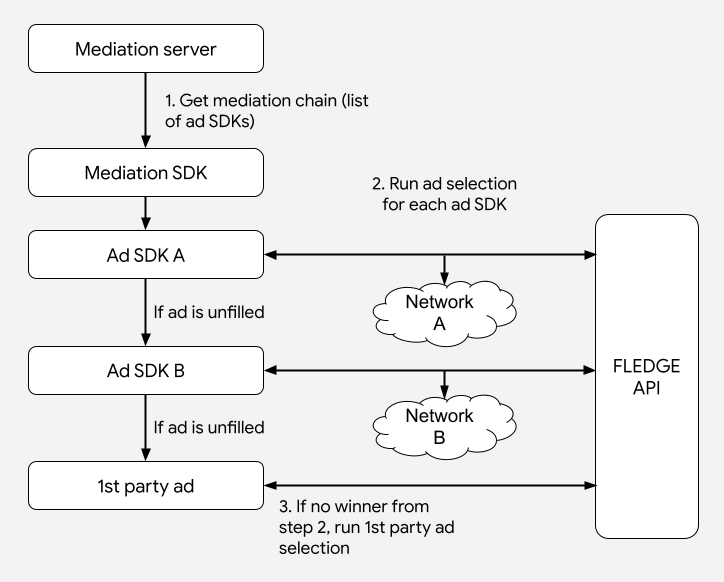
Each additional ad network SDK can add between 0.5 and 2 seconds of latency. Slow load times reduce impression opportunity and session depth.
Apps that reduce SDK bloat through server side mediation often see session length improvements of 5 to 12 percent, directly increasing total impressions.
Privacy and Consent
With Apple ATT and Android Privacy Sandbox policies, unconsented traffic can earn 20 to 40 percent lower eCPMs due to limited targeting signals.
Apps that implement a clear value exchange consent flow, explaining how ads support free features, often improve opt in rates from 35 percent to over 60 percent.
That single shift can increase blended revenue per user by double digit percentages.
Ad Unit Structure
Granular ad unit naming such as Android LevelComplete Rewarded Gold 2026 allows precise reporting. Without segmentation by placement and format, optimization becomes guesswork.
Elite publishers treat reporting like a trading dashboard, not a summary screen.
Beyond AdMob: Competitive Bidding at Scale
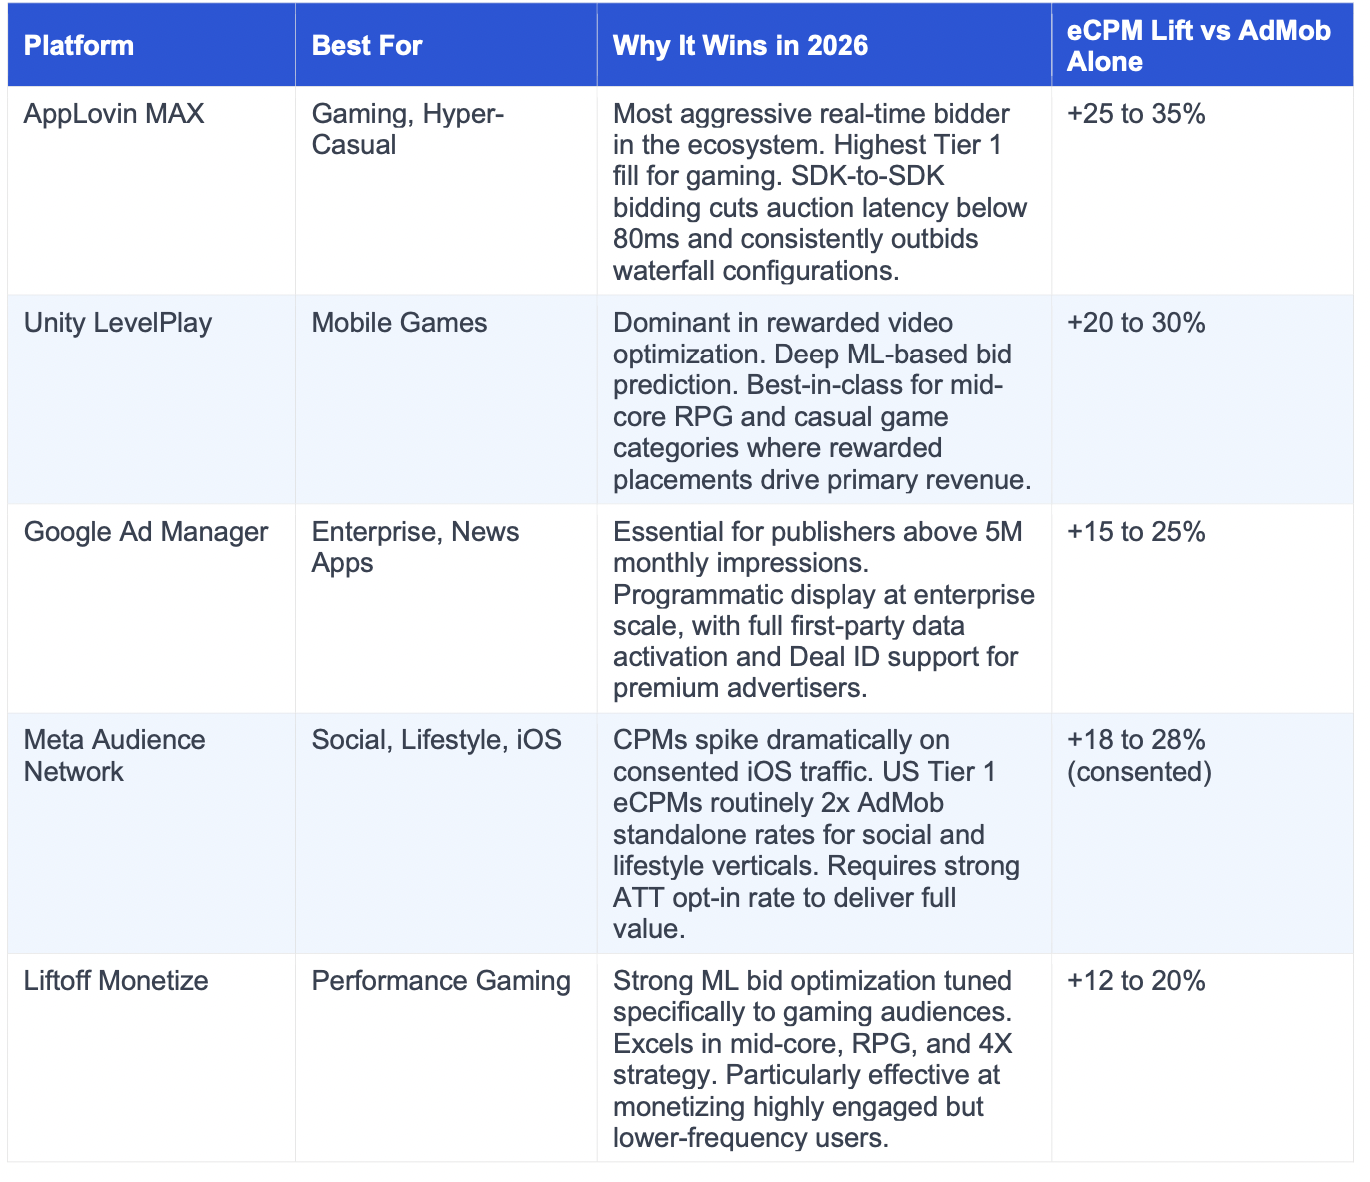
The highest revenue gains in 2026 come from forcing networks like Applovin and GAM to compete.
Publishers who transition from manual waterfall setups to real-time bidding environments often report:
- 15 to 35 percent uplift in eCPMs
- 10 to 25 percent improvement in total ad revenue
- Reduced manual optimization workload
For example, a mid-sized gaming publisher earning 50,000 dollars monthly through basic AdMob mediation can realistically scale to 65,000 to 75,000 dollars monthly after implementing competitive header bidding across 10 to 15 demand partners.
That is not theoretical. That is structural.
Silent Revenue Killers
When Google’s fraud detection identifies patterns like bot traffic, SDK spoofing, click injection, or impression laundering, the response is rarely an immediate account suspension. Instead, they throttle your auction eligibility. This quietly reduces the number of legitimate bids your inventory receives and suppresses eCPMs from premium advertisers who have flagged your app as high-risk.
Publishers trapped in this IVT spiral typically experience an eCPM drop of 30% to 50% over a 4 to 8-week period before the source is even identified. Even after the source is eliminated, recovery is not instant. It generally takes 6 to 12 weeks for Google’s systems to re-evaluate and “trust” your inventory quality again.
IVT Source | Detection Timeline | Revenue Impact | Recovery TimeClick Injection / SDK Fraud | 2 to 4 weeks | eCPM drops 30% to 50% | 6 to 12 weeks post-clean Incentivized Installs (Improper) | 4 to 8 weeks | Bid throttling; premium demand exits | 8 to 16 weeks Bot Traffic (App Emulators) | 1 to 3 weeks | High account risk; full suspension possible | New account or 3+ months Impression Laundering (Partner SDK) | 3 to 6 weeks | GAM policy strike; total fill collapse | 6 to 12 weeks + legal review
Prevention requires monthly IVT audits using MonetizeMore’s Traffic Cop which also does strict vetting of every ad network and user acquisition partner before integration. Any UA source delivering installs below market-rate CPI for your category deserves immediate scrutiny. If the traffic is priced like it is too good to be true, it almost certainly contains signals that will cost you far more than you saved on the install.
The 10X Execution Checklist for 2026
Top apps operate with discipline. They migrate to real time bidding environments instead of relying solely on waterfalls.
They implement hybrid monetization models. Over half of top grossing non gaming apps now combine in app purchases with ads. High intent users pay for premium features. Casual users monetize through rewarded ads.
They review monetization metrics weekly, not quarterly:
Action | What to Do and Why It PaysMove to Real-Time Bidding | Eliminate manual waterfall configurations entirely. Real-time bidding reduces auction latency by up to 60% and consistently delivers 20% to 35% eCPM gains within the first billing cycle. Run waterfall and bidding in parallel for 14 days to benchmark the delta before full cutover. A/B Test Ad Frequency Rigorously | Do not guess at the right number of ads per session. Run statistically valid tests at 2, 3, and 5 ads per session simultaneously across matched user cohorts. Most publishers find 3 ads per session outearns 5 because 30-day retention stays intact, producing more total impression volume over the month. Collect First-Party Interest Data | Deploy 3-question in-app micro-surveys at session 5 or later. Build audience segments around declared interests and behaviors once users demonstrate intent to stay. First-party signals can increase targeting strength by 40% to 60% and push CPMs without adding a single extra impression served. Launch a Hybrid IAP + Ads Model | Run both revenue streams simultaneously. The top-grossing 50% of mobile apps use this model. IAP users generate 8x to 15x the LTV of pure ad-supported users. Serve paying users a reduced ad load at higher eCPMs and let ad revenue carry non-paying users. Audit Floor Prices Monthly | Raise floors in 10% to 15% increments if your fill rate exceeds 90%. This indicates your floor is below the market clearing rate. Hold each test for 72 hours minimum to capture daily demand variance. Target a 75% to 85% fill rate where premium demand dominates and total yield is highest. Validate SDK Latency Weekly | Pull cold-start latency metrics for every SDK in your mediation stack. Any SDK adding more than 1.5 seconds of initialization overhead should be demoted or replaced. Latency above 2 seconds costs you 24% of session-one users before your first ad ever loads. Build a Value-Exchange Consent UX | Create a transparent consent screen explaining the direct benefit of personalized ads. This can recover 25% to 40% of the eCPM lost from unconsented traffic. Well-designed ATT prompts on iOS achieve 55% to 70% opt-in compared to 35% to 45% for generic prompts. Consolidate Payments | Eliminate payment friction from multiple demand networks. Publishers earning $150K per month across 10 networks routinely lose $8K to $12K to various fees and thresholds before funds hit their account. Consolidate through a monetization partner into a single Net-30 wire.
Serious About Scaling? Work With MonetizeMore
If your app has traffic but your revenue curve feels flat, you likely have structural inefficiencies in your monetization stack.
MonetizeMore helps publishers unlock higher yield through advanced header bidding, invalid traffic protection, AdOps management, privacy-compliant optimization, and payment consolidation.
Publishers working with MonetizeMore frequently see revenue uplifts of 20 percent or more within the first optimization cycle, especially when transitioning from single network setups to competitive bidding environments.

Kean Graham is the CEO and founder of MonetizeMore & a pioneer in the Adtech Industry. He is the resident expert in Ad Optimization, covering areas like Adsense Optimization,GAM Management, and third-party ad network partnerships. Kean believes in the supremacy of direct publisher deals and holistic optimization as keys to effective and consistent ad revenue increases.
Recommended Reading

Ad Optimization
June 10, 2026
Static Price Floors Are Costing You Revenue: What AI-Driven Flooring Does Differently

Ad Optimization
May 26, 2026
Ad-Ops for Devs: Solving the ads.txt and Latency Puzzle in Vue, Nuxt, and React
Ad Optimization
May 15, 2026
Beyond the Honeymoon Phase with Ad Revenue Platforms
Trusted by 1,500+ publishers worldwide
10X your ad revenue with our award-winning solutions.
Let's Talk
__Close
Ready to 10X your ad revenue with the #1 ad management partner?
Sign up today and see the results for yourself!
M2 - Sign-up - v16 - Revenue matrix
Realize your ad revenue potential.
- First Name
- Last Name
- Email *
- Phone
- Primary website *
- What is your primary interest?
Select your interest PubGuru | Ad revenue optimization Traffic Cop | Ad inventory & clawback protection
- Your Monthly Ad Revenue (of all sites) *
Select one Less than $5,000 per month $5,000 - $10,000 per month $10,000 - $20,000 per month More than $20,000 per month
- Average Monthly Pageviews
Select one Less than 1 million 1 million - 5 million 5 million - 10 million 10 million - 20 million More than 20 million
- Describe your business *
Select one Publisher Ad Tech Vendor
- Number of Domains (Total) *
Select one 1 domain 2 - 10 domains 10 - 50 domains 50 - 200 domains More than 200 domains
- Where are you located?
Select your country Afghanistan Aland Islands Albania Algeria Andorra Angola Anguilla Antarctica Antigua and Barbuda Argentina Armenia Aruba Australia Austria Azerbaijan Bahamas Bahrain Bangladesh Barbados Belarus Belgium Belize Benin Bermuda Bhutan Bolivia, Plurinational State of Bonaire, Sint Eustatius, and Saba Bosnia and Herzegovina Botswana Bouvet Island Brazil British Indian Ocean Territory Brunei Darussalam Bulgaria Burkina Faso Burundi Cambodia Cameroon Canada Cape Verde Cayman Islands Central African Republic Chad Chile China Christmas Island Cocos (Keeling) Islands Colombia Comoros Congo Congo, the Democratic Republic of the Cook Islands Costa Rica Cote d’Ivoire Croatia Cuba Curaçao Cyprus Czechia Denmark Djibouti Dominica Dominican Republic Ecuador Egypt El Salvador Equatorial Guinea Eritrea Estonia Eswatini Ethiopia Falkland Islands (Malvinas) Faroe Islands Fiji Finland France French Guiana French Polynesia French Southern Territories Gabon Gambia Georgia Germany Ghana Gibraltar Greece Greenland Grenada Guadeloupe Guatemala Guernsey Guinea Guinea-Bissau Guyana Haiti Heard Island and McDonald Islands Holy See (Vatican City State) Honduras Hungary Iceland India Indonesia Iran, Islamic Republic of Iraq Ireland Isle of Man Israel Italy Jamaica Japan Jersey Jordan Kazakhstan Kenya Kiribati Korea, Democratic People’s Republic of Korea, Republic of Kosovo Kuwait Kyrgyzstan Lao People’s Democratic Republic Latvia Lebanon Lesotho Liberia Libya Liechtenstein Lithuania Luxembourg Macao Madagascar Malawi Malaysia Maldives Mali Malta Martinique Mauritania Mauritius Mayotte Mexico Moldova, Republic of Monaco Mongolia Montenegro Montserrat Morocco Mozambique Myanmar Namibia Nauru Nepal Netherlands New Caledonia New Zealand Nicaragua Niger Nigeria Niue Norfolk Island North Macedonia Norway Oman Pakistan Palestine Panama Papua New Guinea Paraguay Peru Philippines Pitcairn Poland Portugal Puerto Rico Qatar Reunion Romania Russian Federation Rwanda Saint Barthélemy Saint Helena, Ascension and Tristan da Cunha Saint Kitts and Nevis Saint Lucia Saint Martin (French part) Saint Pierre and Miquelon Saint Vincent and the Grenadines Samoa San Marino Sao Tome and Principe Saudi Arabia Senegal Serbia Seychelles Sierra Leone Singapore Sint Maarten (Dutch part) Slovakia Slovenia Solomon Islands Somalia South Africa South Georgia and the South Sandwich Islands South Sudan Spain Sri Lanka Sudan Suriname Svalbard and Jan Mayen Sweden Switzerland Syrian Arab Republic Taiwan Tajikistan Tanzania, United Republic of Thailand Timor-Leste Togo Tokelau Tonga Trinidad and Tobago Tunisia Turkey Turkmenistan Turks and Caicos Islands Tuvalu Uganda Ukraine United Arab Emirates United Kingdom United States Uruguay Uzbekistan Vanuatu Venezuela, Bolivarian Republic of Vietnam Virgin Islands, British Wallis and Futuna Western Sahara Yemen Zambia Zimbabwe
- utm_source
- utm_medium
- utm_campaign
- utm_content
- utm_term
- ga_client_id
- submission_page
- gclid
- lang
- i_source
- i_medium
- i_campaign
- i_content
- tap_aff
-
- Do Not Fill This Out
Want to speed up your verification process?
Share a screenshot of your ad revenue from the past 3 months.
Upload your Revenue Proof
For faster processing of your application
- Upload a screenshot *
Have additional websites for review?
- Additional Website URL 1
- Additional Website URL 2
- Additional Website URL 3
- Email*
- ga_client_id
- submission_page
- wufoo_entry_id
- Do Not Fill This Out
For Publishers
- PubGuru Premium
- Traffic Cop Premium
- PubGuru®
- Traffic Cop
- Google AdX Partner
- App Monetization
- PubGuru Analytics
- Smart Refresh
- Page Report
- Unified Pricing Rules
- Offerwall Studio
- Outstream Ads
Explore
- Blog
- Webinars
- Customers Testimonials
- Case Studies
- Media Center
- Notifications Center
- Partner Integrations
- Ad Revenue Calculator
Get the latest Ad Ops tips from industry experts
M2 - Newsletter Subscribe - En - Email Only
Subscribe to us and receive the latest insights!
- utm_source
- utm_medium
- utm_campaign
- utm_term
- utm_content
- submission_page
- ga_client_id
- lang
- i_source
- i_medium
- i_campaign
- Do Not Fill This Out
Book a meeting with MonetizeMore
Your Monthly Ad Revenue (of all sites) Select one Less than $1,000 per month $1,000 - $5,000 per month $5,000 - $10,000 per month $10,000 - $20,000 per month More than $20,000 per month
Where are you located? Select your country Afghanistan Aland Islands Albania Algeria Andorra Angola Anguilla Antarctica Antigua and Barbuda Argentina Armenia Aruba Australia Austria Azerbaijan Bahamas Bahrain Bangladesh Barbados Belarus Belgium Belize Benin Bermuda Bhutan Bolivia, Plurinational State of Bonaire, Sint Eustatius, and Saba Bosnia and Herzegovina Botswana Bouvet Island Brazil British Indian Ocean Territory Brunei Darussalam Bulgaria Burkina Faso Burundi Cambodia Cameroon Canada Cape Verde Cayman Islands Central African Republic Chad Chile China Christmas Island Cocos (Keeling) Islands Colombia Comoros Congo Congo, the Democratic Republic of the Cook Islands Costa Rica Cote d'Ivoire Croatia Cuba Curaçao Cyprus Czechia Denmark Djibouti Dominica Dominican Republic Ecuador Egypt El Salvador Equatorial Guinea Eritrea Estonia Eswatini Ethiopia Falkland Islands (Malvinas) Faroe Islands Fiji Finland France French Guiana French Polynesia French Southern Territories Gabon Gambia Georgia Germany Ghana Gibraltar Greece Greenland Grenada Guadeloupe Guatemala Guernsey Guinea Guinea-Bissau Guyana Haiti Heard Island and McDonald Islands Holy See (Vatican City State) Honduras Hungary Iceland India Indonesia Iran, Islamic Republic of Iraq Ireland Isle of Man Israel Italy Jamaica Japan Jersey Jordan Kazakhstan Kenya Kiribati Korea, Democratic People's Republic of Korea, Republic of Kosovo Kuwait Kyrgyzstan Lao People's Democratic Republic Latvia Lebanon Lesotho Liberia Libya Liechtenstein Lithuania Luxembourg Macao Madagascar Malawi Malaysia Maldives Mali Malta Martinique Mauritania Mauritius Mayotte Mexico Moldova, Republic of Monaco Mongolia Montenegro Montserrat Morocco Mozambique Myanmar Namibia Nauru Nepal Netherlands New Caledonia New Zealand Nicaragua Niger Nigeria Niue Norfolk Island North Macedonia Norway Oman Pakistan Palestine Panama Papua New Guinea Paraguay Peru Philippines Pitcairn Poland Portugal Puerto Rico Qatar Reunion Romania Russian Federation Rwanda Saint Barthelemy Saint Helena, Ascension and Tristan da Cunha Saint Kitts and Nevis Saint Lucia Saint Martin (French part) Saint Pierre and Miquelon Saint Vincent and the Grenadines Samoa San Marino Sao Tome and Principe Saudi Arabia Senegal Serbia Seychelles Sierra Leone Singapore Sint Maarten (Dutch part) Slovakia Slovenia Solomon Islands Somalia South Africa South Georgia and the South Sandwich Islands South Sudan Spain Sri Lanka Sudan Suriname Svalbard and Jan Mayen Sweden Switzerland Syrian Arab Republic Taiwan Tajikistan Tanzania, United Republic of Thailand Timor-Leste Togo Tokelau Tonga Trinidad and Tobago Tunisia Türkiye Turkmenistan Turks and Caicos Islands Tuvalu Uganda Ukraine United Arab Emirates United Kingdom United States Uruguay Uzbekistan Vanuatu Venezuela, Bolivarian Republic of Vietnam Virgin Islands, British Wallis and Futuna Western Sahara Yemen Zambia Zimbabwe
Get started